What is Residential Demand?
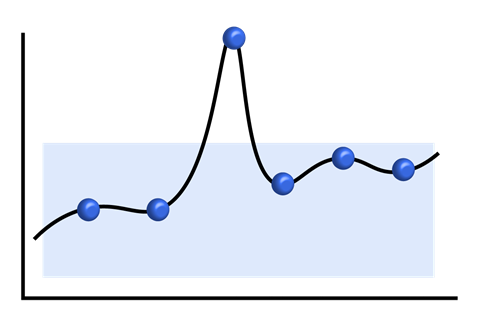
When we talk about demand for electricity, we mean how much power is being used from the grid at the same time. For billing, residential demand looks at each customer’s highest “at one time” usage and applies a monthly demand charge to that.
Why is there a demand charge?
The demand charge helps fairly share the cost of building and maintaining the electric system.
Higher demand means higher costs for grid capacity and power purchases, so the demand charge helps reflect those costs.
How is my demand measured?
The demand charge is $1 per kilowatt during the highest hour of usage within each billing period.
You can lower your demand charge by avoiding running many large appliances at the same time. For example, if you run your air conditioner, charge your electric vehicle, do laundry, and run the dishwasher all at once, your demand will be much higher than if you stagger those tasks throughout the day.
For example, in the electric study conducted for the DPU in 2025, the average residential peak demand was estimated at about 7 kW, which would result in a $7.00 demand charge for that month.
Note: Demand is measured independently of Time-of-Use (TOU) peak and off-peak hours.
Demand examples

The charts above and below represent two households, both using 60 kWh in a 24-hour period. Household One's demand is 6 KW and Household Two's demand is 3 KW, even though both households use the same total kWh. Household One will have a higher financial impact on the distribution system and infrastructure because they are requiring more from the grid by drawing 6 KW of electricity at once, while Household Two is requiring no more than 3 KW of electricity at once. Assume this 24-hour period represents each customer's highest demand day of the billing period. Household One will see a higher demand charge for the billing period as it will be based on 6 KW while Household Two's demand charge will be based on only 3 KW.
